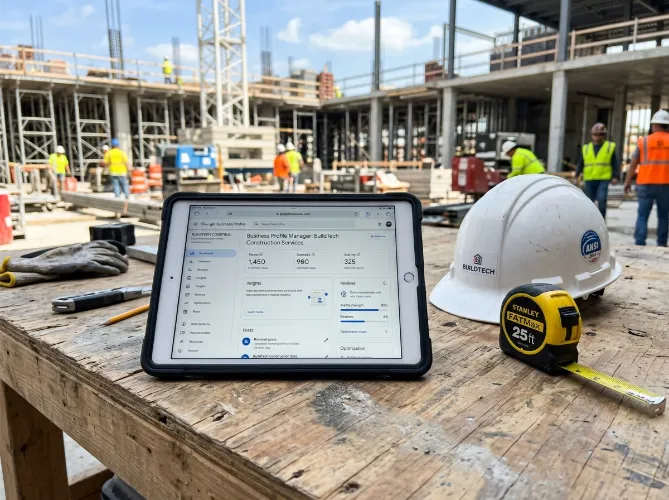












He thought Google had changed something. That’s honestly what the client believed after watching his rankings slide for fourteen straight months. He refreshed some copy. He ran a Google Ads campaign. He even asked a mate who dabbled in SEO on the side. None of it moved the needle. What nobody had actually done was open PageSpeed Insights and look at the website itself.
That number, 34, told the whole story on its own.
This isn’t a content strategy story, and it isn’t a link building one either. This WordPress redesign case study UK is about what happens when a website quietly falls apart underneath a business, and what a proper WordPress redesign actually delivers once it’s done right.
What a PageSpeed Score of 34 Actually Means
Put Simply, Google Doesn’t Want to Send People There
PageSpeed scores aren’t some abstract vanity number. A mobile score of 34 means real people, on real connections, are waiting over eight seconds just to see the main content load. Most won’t wait that long. They hit back and click the next result instead. That behaviour feeds straight into Google’s page experience signals, which feed back into rankings, which quietly strangles traffic, which means fewer people ever reach the contact form. It compounds for months before anyone notices the enquiry rate has dropped, and by then nobody can explain why.
Here’s What the Technical Audit Actually Found
| Issue | Detail |
|---|---|
| Largest Contentful Paint | 8.3 seconds on a standard 4G mobile connection |
| Active plugins | 24, several completely redundant, all loading assets regardless of page content |
| Image optimisation | Uncompressed images averaging 1.9MB each, no WebP conversion anywhere |
| Slider plugins | Three separate plugins loading a combined 400kb of JavaScript on every page |
| Cumulative Layout Shift | Failing badly, image and font dimensions were never specified |
| Loading optimisation | No lazy loading, no resource hints, no font display optimisation at all |
Turns out the page builder plugin was the real culprit. These tools generate CSS for every layout option they offer, whether the site actually uses them or not. So the stylesheet loading on every single page carried rules for grid layouts, animation effects, and design elements the site had never touched. You can’t just strip that out with an optimisation plugin, because the bloat is baked straight into the theme’s architecture. The only genuine fix left was a full WordPress redesign.
Why Patching the Old Site Was Never Going to Work
Five Years of Accumulated Decisions Don’t Just Optimise Away
There’s a popular myth that WordPress speed optimisation comes down to picking the right plugin stack. WP Rocket, Imagify, a CDN thrown on top, and suddenly the score jumps. And it does jump, sometimes by a lot. But there’s a ceiling on what caching and compression can achieve when the underlying code is genuinely inefficient. For a page builder site that wasn’t built with performance in mind, that ceiling usually sits somewhere around 55 to 65 on mobile, no matter how many optimisation layers get stacked on top.
The client’s website already had a caching plugin running, alongside active image compression. Despite these superficial fixes, the mobile performance score remained stuck at 34 because the underlying theme code was fundamentally bloated.
A custom-built theme doesn’t hit that same wall. There’s no unused CSS clogging things up, because the stylesheet only contains rules for what the site actually uses. Nothing loads JavaScript for features that aren’t even present on the page. Images get sized and formatted properly at the upload stage instead of being compressed after the fact as an afterthought. The performance headroom is a completely different world.
How the WordPress Redesign Actually Ran
Three Weeks of Planning Before a Single Line of Code Got Written
Discovery sessions mapped out every page template the site would need. Plugin requirements got audited down to the essentials, and only nine made the cut from the original twenty-four. The image library was catalogued so reprocessing into WebP format could happen systematically, rather than one upload at a time, which would’ve taken forever. Core Web Vitals targets were set as formal acceptance criteria for each template, meaning the build simply couldn’t be signed off until those targets were actually hit in staging.
That last part matters more than most clients expect going in. Treating performance targets as acceptance criteria, rather than some nice-to-have aspiration, changes how the entire build gets approached. Decisions about image loading, JavaScript execution, and font rendering get made with the score in mind right from the first template, not bolted on as a cleanup exercise at the end.
By week five, with content still being finalised, the staged site was already scoring 91 on mobile PageSpeed Insights. That held at launch and even ticked up slightly to 93 by the one month post-launch check, once the CDN cache had properly warmed up.
Handling the Migration Without Losing What Already Worked
Five Years of URLs Means Five Years of Potential Redirect Headaches
The migration side of this project carried its own risks. URL structures that had built up over five years of content additions weren’t always logical, and quite a few of them carried genuine organic ranking value. So every single URL on the old site got mapped before a single redirect was written. Old blog posts untouched in three years still had inbound links pointing at them, and those needed clean 301s, not 404 errors waiting to happen.
GSC got checked daily for the first two weeks after launch. A handful of redirect edge cases surfaced in the crawl data that hadn’t shown up in pre-launch testing, and they were fixed within 48 hours, well before any ranking impact had time to build up. That kind of post-launch monitoring window gets built into every migration project we run, regardless of size.
Rankings started recovering within six weeks. Not gradually either, it was noticeable. Pages that had been stuck on page two or three for months climbed back toward the positions they’d held before the decline even started. Core Web Vitals field data in GSC hit fully passing status within three weeks of launch.
What the Numbers Looked Like at the Ten Week Mark
Real Figures Pulled From the CRM, Not Estimated From Analytics
| Metric | Before | After 10 Weeks |
|---|---|---|
| Mobile PageSpeed | 34 | 91 |
| LCP | 8.3 seconds | 2.1 seconds |
| Lead form submissions | Baseline | Up 180% |
| Plugin count | 24 | 9 |
| Rankings | Declining | Recovered within 6 weeks |
Lead growth was confirmed directly against the client’s CRM records rather than relying on loose traffic estimates. Real form submissions and phone enquiries surged, resulting in a 180% increase in qualified leads within the first three months post-launch.
There’s a version of this story where the client spends another year chasing different marketing channels, pouring money into ads to compensate for a conversion rate quietly being throttled by a slow site, and never quite figures out why nothing sticks. That’s genuinely what was happening before the audit forced the issue.
The estate agent case study showed what fixing technical debt can do for a site that already had decent content behind it. This one shows what happens when the technical foundation itself is the actual problem. At Webranko the PageSpeed audit is always free, because in our experience that single number tells you more about why a site isn’t performing than almost any other metric out there. And 34 told us everything we needed to know.